Coverage of Breast Cancer Screening and Prevention Services
Among women in the United States, breast cancer is the most commonly diagnosed cancer and the second leading cause of cancer death. In 2016, an estimated 3.5 million women in the U.S. were living with breast cancer. The Affordable Care Act (ACA) and many state laws have provisions that assure that most women with private insurance, Medicaid, and Medicare have coverage for breast cancer screening services. This typically includes screening mammography for the general population of women, but also can include genetic testing and preventive medications for high-risk women over the age of 35. This factsheet discusses breast cancer screening and prevention services, and reviews the scope of private and public insurance coverage, as well as access to those services for women in the US.
Breast Cancer in the United States
Breast cancer is the most commonly diagnosed cancer among women in the U.S. and makes up 15% of all new cancer diagnoses. Approximately 1 in 8 women (12.8%) will be diagnosed with breast cancer during their lifetime.
- In 2019 there will be an estimated 268,600 new cases of female breast cancer and 41,760 deaths attributable to breast cancer.
- Breast cancer is most commonly diagnosed among middle-aged and older women, with 70% of new cases diagnosed among women 55 and older (Figure 1).
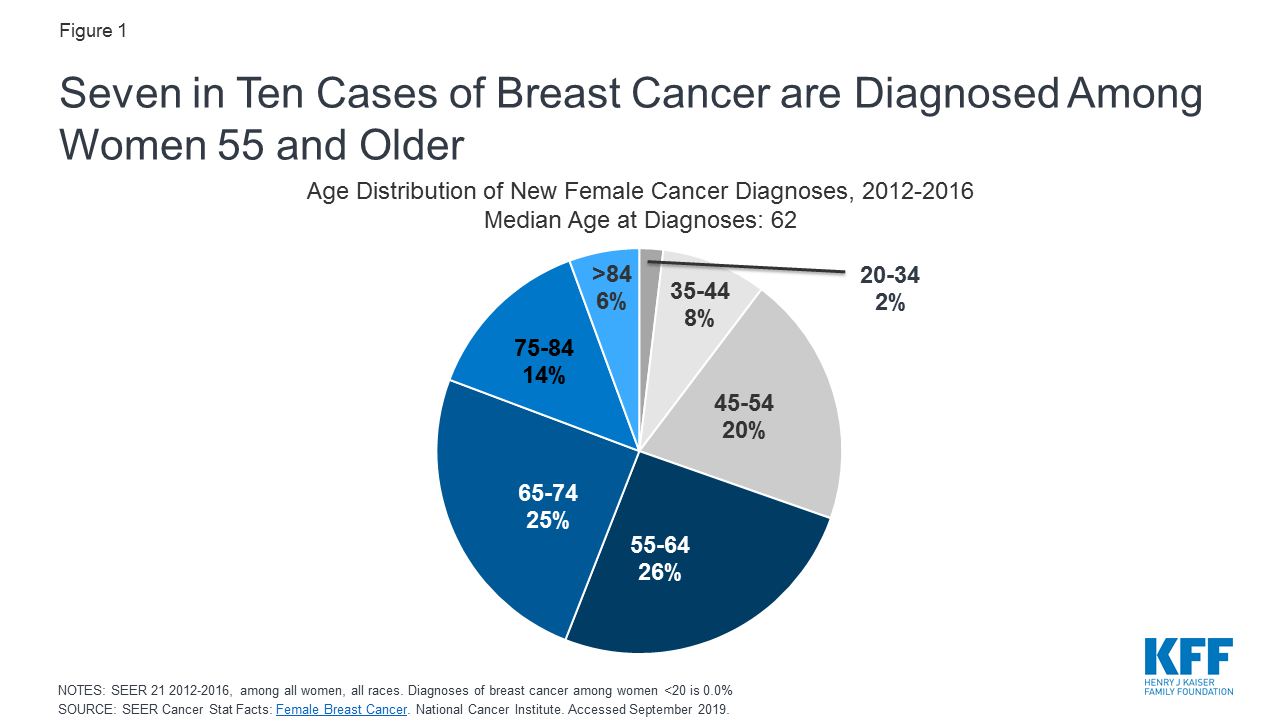
Figure 1: Seven in Ten Cases of Breast Cancer are Diagnosed Among Women 55 and Older
- Most breast cancers are diagnosed at an early stage. Sixty-two percent of breast cancers diagnosed are localized, meaning they are found only in the part of the body they started, while 6% of cases diagnosed have metastasized, meaning the cancer has spread to other regions of the body.
- Risk factors for breast cancer include but are not limited to: a family history of breast cancer, genetic predispositions, personal history with breast cancer, breast density, obesity, drinking alcohol, early menstruation, delayed childbearing and having fewer children.
- In the U.S., while white women have the highest incidence of breast cancer, black women have higher breast cancer mortality rates (Figure 2). These disparities are likely attributable to a combination of factors, such as differences in stage at diagnoses, tumor biology, and genetics, as well as disparities in access to screening, follow up care and treatment.
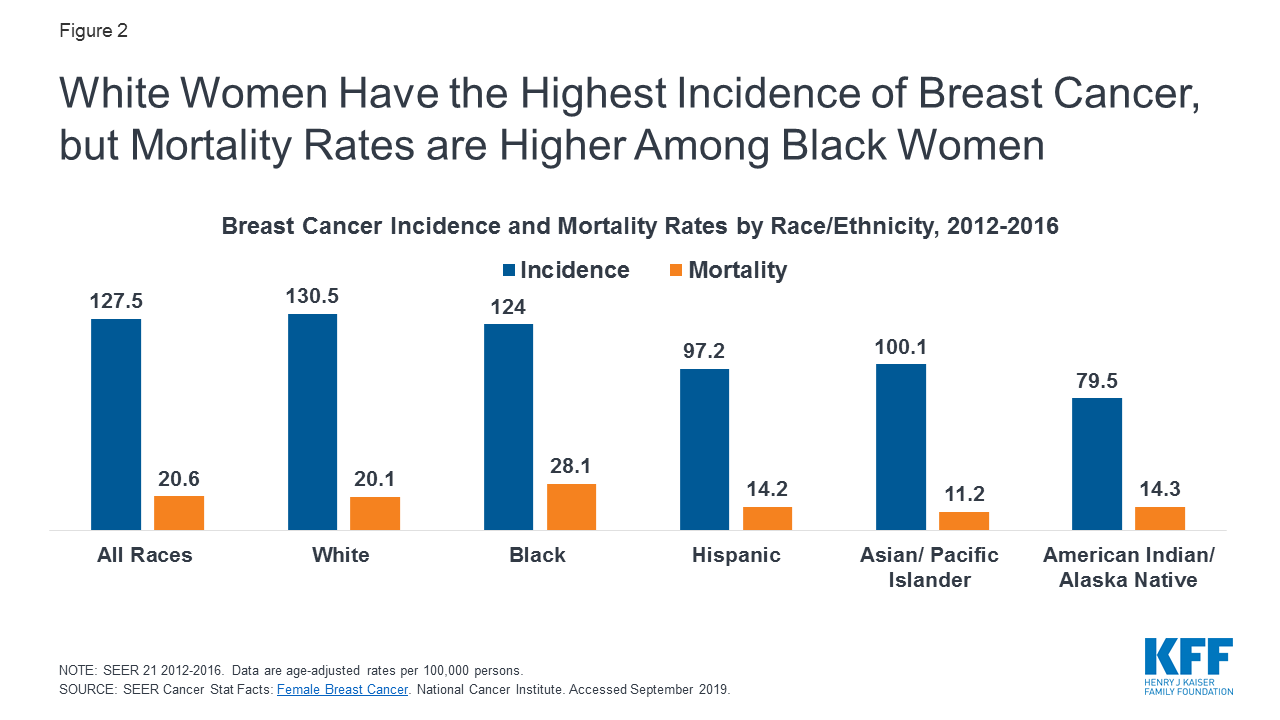
Figure 2: White Women Have the Highest Incidence of Breast Cancer, but Mortality Rates are Higher Among Black Women
- Although very rare, men can develop breast cancer. In 2019, there will be approximately 2,670 cases of male breast cancer diagnosed and 500 deaths.
Coverage for Breast Cancer Screening and Prevention
While several health organizations issue guidelines for breast cancer screening and prevention, private insurance coverage of preventive services under the ACA is governed by recommendations from the United States Preventive Services Task Force (USPSTF) and the Health Resources and Services Administration (HRSA). Under these guidelines, private group and individual insurance plans and state Medicaid expansion programs must cover the following breast cancer screening and prevention services at no cost to the consumer: 1) screening mammography at least every 2 years and as frequently as once a year for women ages 40 to 74 with average-risk for breast cancer; 2) genetic counseling and testing for mutation of the BRCA1 and BRCA2 genes in some women with a personal or family history of breast, ovarian, fallopian tube, or peritoneal cancer; 3) preventive medication for some women with elevated risk of breast cancer and at low risk for adverse medication effects (Table 1). Some medical professionals recommend other services, such as screening MRIs for women at higher risk for breast cancer, but these services are not currently subject to the ACA’s preventive services coverage requirement.
| Table 1: Breast Cancer Preventive Services Covered Without Cost-Sharing |
| Preventive Service | Target Population | Recommendation |
Breast Cancer Screening
(HRSA & USPSTF) | Women ages 40 to 74 with average-risk for breast cancer (HRSA) |
- Mammography is a low-dose x-ray procedure that provide images of the internal structures of the breast and is the most common screening test for breast cancer.
- Current HRSA guidelines, which define no-cost coverage standards for private insurance, recommend biennial screening mammography to start no earlier than age 40 and no later than age 50 for average-risk women and continue through at least age 74, while the USPSTF breast cancer screening guidelines recommend biennial screening mammography for women aged 50 to 74, and states that starting mammography screening before age 50 should be an individual decision based on preference and patient values. The USPSTF also concludes that there is insufficient evidence to assess the benefits and harms of screening mammography for women 75 years and older.
- In 2015, 58% of women ages 40-49 and 72% of women ages 50-74 reported having had a mammogram in the past two years (Figure 3). Overall, between 2000 and 2015, mammography rates stayed relatively stable. Black women (70%) and women with some college education and more (71%) have the highest mammography rates (AppendixTable 1).
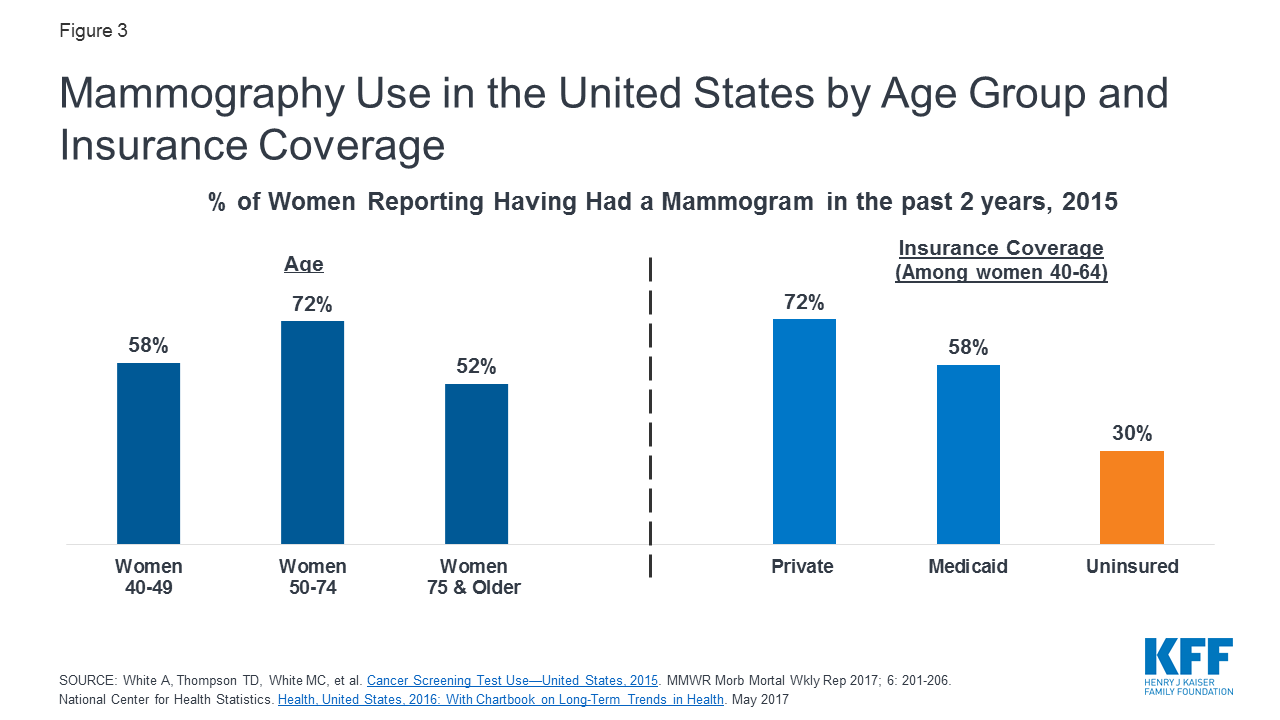
Figure 3: Mammography Use in the United States by Age Group and Insurance Coverage
- Mammography rates vary by state. Ohio and Kansas reported the highest mammography rates (81%) in the nation, while Connecticut reported the lowest rates at 61% (Figure 4 & Appendix Table 2).
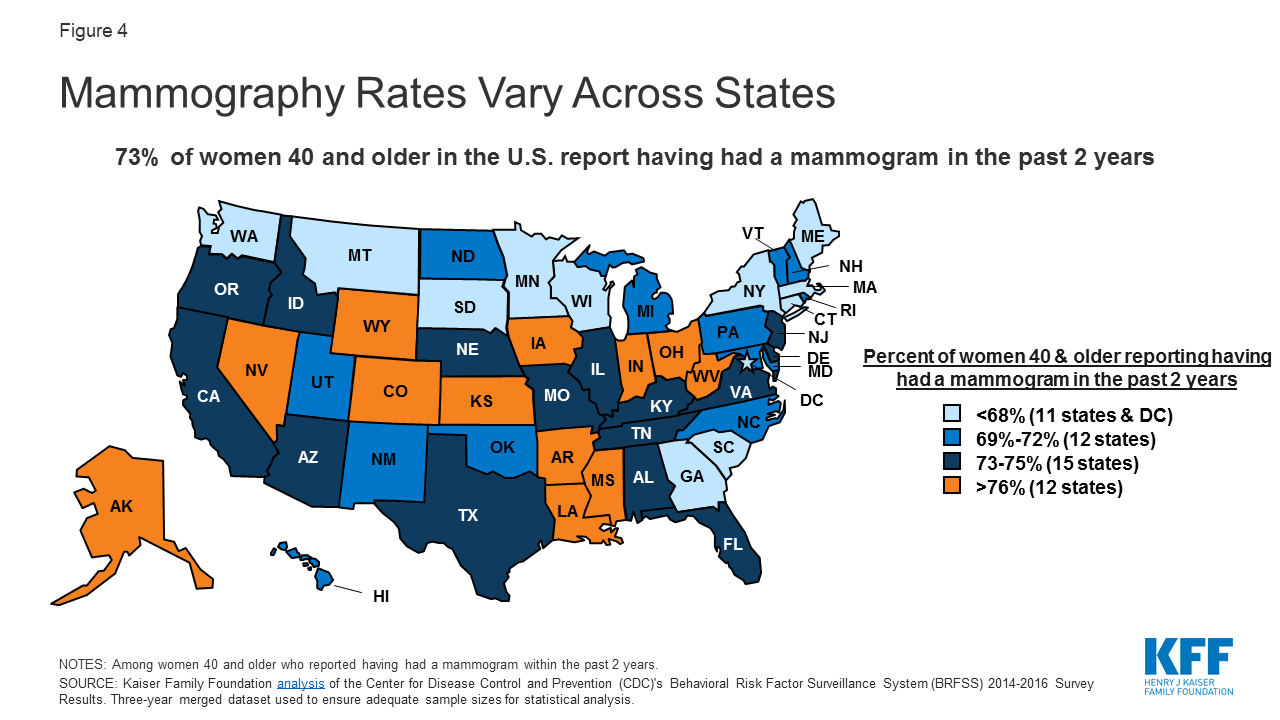
Figure 4: Mammography Rates Vary Across States
- Research shows that women with insurance coverage are more likely to report having had a mammogram in the past two years. In 2015, only 30% of uninsured women ages 40 to 64 reported having had a mammogram in the past two years compared to 72% of privately insured women and 58% of women with Medicaid coverage (Figure 3).
- Most professional guidelines suggest starting mammography after age 40, but 47% of women believe women without a family history of breast cancer should begin mammography screening before age 40 (Figure 5).
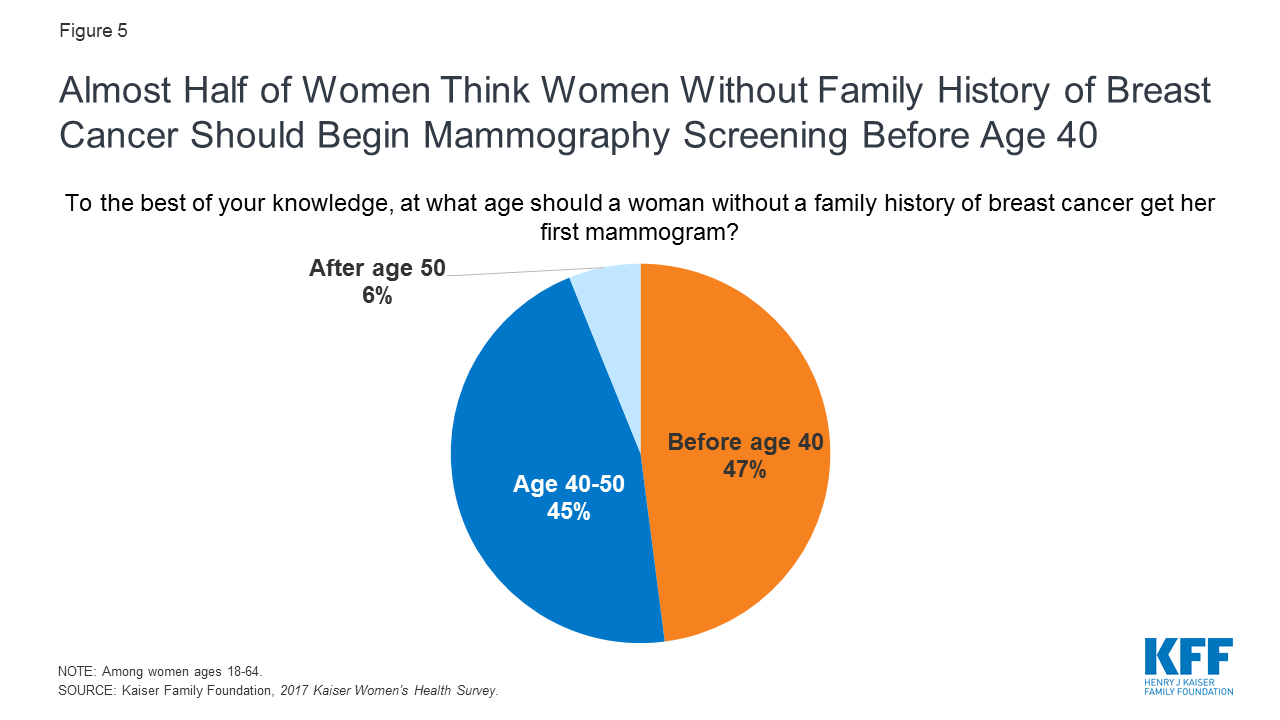
Figure 5: Almost Half of Women Think Women Without Family History of Breast Cancer Should Begin Mammography Screening Before Age 40
Genetic Testing and Screening for BRCA1/BRCA2 Mutations
- Mutations to BRCA1 and BRCA2, tumor suppressor genes, increase the risk of female breast and ovarian cancers, as well as Fallopian tube, peritoneum, pancreatic, and skin cancers. While almost 13% of women in the general population will develop breast cancer at some point in their lives, 72% of women who have inherited the BRCA1 mutation and 69% of women who have inherited the BRCA2 mutation will develop breast cancer by the age of 80.
- Factors associated with an increased likelihood of having a harmful BRCA1 or BRCA2 mutation include: breast cancer diagnoses before age 50, cancer in both breasts, both breast and ovarian cancers in the same individual, multiple cases of breast cancers, two or more BRCA1 or BRCA2 related cancer deaths in the family, cases of male breast cancer, and being of Ashkenazi Jewish descent.
- Currently, the USPSTF recommends that primary care providers screen women with a personal or family history of breast, ovarian, tubal, or peritoneal cancers or have an ancestry associated with BRCA 1/ 2 gene mutations with one of several screening tools for an increased risk in BRCA genetic mutations. The USPSTF recommends that women with positive screenings receive genetic counseling and if necessary BRCA genetic testing.
Preventive Medication
- The use of medications to help reduce the risk of or delay the onset of cancer is called chemoprevention. The drugs tamoxifen, raloxifene, and aromatase inhibitors reduce primary breast cancer risk in postmenopausal women.
- The USPSTF recommends that clinicians should discuss and offer to prescribe these risk-reducing medications to some women 35 and older who are at an increased risk for breast cancer and at low-risk for adverse medication effects. Women who are not at an increased risk for breast cancer should not take these medications.
Coverage and Utilization of Services
Most women with public and private insurance have coverage for breast cancer screening services, but the scope of coverage can differ based on the type of insurance plan, how they qualify for Medicaid, and in the case of Medicare, where they live. While there are programs to assist uninsured and underserved women, these programs only reach a fraction of eligible women.
- Private Individual and Group Insurance Plans—The ACA requires most private group and individual insurance plans, including most employer plans, to cover all services rated by the USPSTF with an “A” or “B” without consumer cost-sharing, as well as preventive services for women recommended by HRSA. Plans must cover the full cost of mammograms starting at age 40, genetic screening for high-risk women, and breast cancer preventive medication for high risk women under this policy.
- Medicaid— Women who qualify for Medicaid based on their state’s decision to expand Medicaid under the ACA are entitled to the same screening and preventive services as women who are covered by private insurance. For women who qualify based on other traditional eligibility pathways, breast cancer screening and preventive services are considered “optional” under traditional Medicaid programs and the scope of coverage is determined by the state. A 2015 state survey of Medicaid programs, however, found that most states cover breast cancer screening and prevention services under expansion and traditional eligibility pathways.
- Medicare—Medicare Part B covers annual screening mammograms at no-cost for women 40 and over. Coverage for BRCA genetic testing is not required nationally, but may be covered in some regions based on local coverage determinations. Women enrolled in a Medicare Part D drug plan who are at high risk for breast cancer may have coverage for chemoprevention drugs, but there is no requirement for Part D plans to cover these drugs without cost sharing.
- TRICARE—TRICARE, the public program for military personnel and dependents, covers screening mammography for women 40 and older, BRCA genetic counseling, and chemoprevention, but is not required to offer coverage without cost-sharing. Out-of-pocket costs for consumers vary by an individual’s specific level of TRICARE coverage and active duty status.
- The National Breast and Cervical Cancer Early Detection Program (NBCCEDP)—The NBCCEDP helps low-income, uninsured, and underinsured women gain access to breast and cervical cancer screening, diagnostic services, and referrals to treatment. Uninsured and underinsured women are eligible for the program if they are at or below 250% Federal Poverty Level (FPL) and are between the ages of 40 to 64 for breast cancer screenings. Although about 10% of U.S. women are eligible for the NBCCEDP breast cancer screenings, the program only serves about 11% of those who are eligible. In 2017 almost 192,000 women received NBCCEDP funded mammograms.
- The Breast and Cervical Cancer Prevention and Treatment Act (BCCPTA)—Passed in 2000, the BCCPTA gives states the option to extend Medicaid coverage to uninsured women under 65 who are diagnosed with breast or cervical cancer through NBCCEDP screening programs. Although all states adopted this option, states have different eligibility requirements. In 20 states and DC, women are only eligible for Medicaid coverage if their screening and diagnosis was paid for by NBCEEDP funds; in 14 states women are eligible for Medicaid if their provider receives NBCEEDP funds or the services provided fell within the scope of the NBCEEDP grant; and in 16 states women are eligible for Medicaid coverage for treatment regardless of where they were screened as long as they meet the other eligibility criteria. In 2013, almost 57,000 uninsured women with a breast cancer diagnosis gained Medicaid coverage through the BCCPTA.
- While many women now receive no-cost coverage for mammography services, women who get diagnostic mammograms, those who get preventive services out-of-network or who are in grand-fathered plans may be subject to co-payments, cost-sharing or deductibles. In the 2017 Kaiser Women’s Health Survey, 16% of women with private insurance reported paying out-of-pocket costs for a mammogram, compared to 3% of women with Medicaid coverage and 11% of uninsured women.
Appendix Table 1
| Appendix Table 1: Use of Mammography Among Women 40 and Over, 2015 |
Percent of women who have had a mammogram
in the past 2 years, ages 40 and older |
| RACE/ETHNICITY, 40 and older |
| White | 65.8% |
| Black | 69.7% |
| Hispanic | 60.9% |
| POVERTY LEVEL, 40 and older |
| Below 100% | 52.2% |
| 100-199% | 54.9% |
| 200%-399% | 63.4% |
| 400%+ | 74.7% |
| EDUCATION |
| No High School Diploma or GED | 51.7% |
| High School Diploma or GED | 60.1% |
| Some College or More | 70.5% |
| SOURCE: National Center for Health Statistics. Health, United States, 2016: With Chartbook on Long-Term Trends in Health. May 2017 |
Appendix Table 2
| Appendix Table 2: Mammography Rates by State, 2014-2016 |
| Percent of women ages 40 and older who report having had a mammogram within the past 2 years |
| State | All Women | White | Black | Hispanic | Asian & Native
Hawaiian or Pacific Islander | American Indian/
Alaska Native |
| United States | 73% | 73% | 78% | 72% | 72% | 67% |
| Alabama | 73% | 71% | 79% | n/a | n/a | 68% |
| Alaska | 79% | 79% | 83% | 70% | n/a | n/a |
| Arizona | 75% | 71% | 79% | 67% | n/a | n/a |
| Arkansas | 76% | 75% | 80% | 77% | 77% | n/a |
| California | 75% | 73% | 81% | 60% | 72% | n/a |
| Colorado | 78% | 76% | n/a | 79% | 79% | n/a |
| Connecticut | 61% | 62% | n/a | 47% | n/a | n/a |
| Delaware | 73% | 73% | 79% | 72% | n/a | n/a |
| DC | 67% | 67% | 73% | 69% | n/a | n/a |
| Florida | 74% | 74% | 80% | 73% | n/a | n/a |
| Georgia | 63% | 62% | n/a | n/a | n/a | 68% |
| Hawaii | 71% | 72% | 74% | 57% | n/a | 63% |
| Idaho | 74% | 74% | 76% | n/a | n/a | n/a |
| Illinois | 74% | 72% | 78% | 73% | n/a | n/a |
| Indiana | 77% | 77% | n/a | n/a | n/a | 60% |
| Iowa | 78% | 77% | 84% | 77% | 69% | 71% |
| Kansas | 81% | 81% | 81% | 83% | 82% | n/a |
| Kentucky | 75% | 75% | 79% | 72% | 78% | n/a |
| Louisiana | 76% | 77% | 75% | 72% | 59% | 69% |
| Maine | 68% | 67% | 71% | n/a | n/a | n/a |
| Maryland | 69% | 68% | 77% | 79% | n/a | n/a |
| Massachusetts | 68% | 68% | n/a | 54% | n/a | 66% |
| Michigan | 69% | 70% | 70% | 55% | n/a | 56% |
| Minnesota | 68% | 67% | 69% | 70% | 70% | n/a |
| Mississippi | 78% | 78% | n/a | n/a | n/a | n/a |
| Missouri | 75% | 74% | 80% | 79% | 71% | n/a |
| Montana | 65% | 65% | n/a | 66% | n/a | 64% |
| Nebraska | 74% | 74% | 77% | 79% | 67% | 63% |
| Nevada | 76% | 76% | 78% | 62% | n/a | 71% |
| New Hampshire | 72% | 73% | n/a | n/a | n/a | 67% |
| New Jersey | 73% | 72% | 78% | 70% | n/a | 88% |
| New Mexico | 70% | 70% | 76% | 67% | 61% | 63% |
| New York | 68% | 67% | 70% | 62% | n/a | 72% |
| North Carolina | 69% | 70% | n/a | 62% | n/a | n/a |
| North Dakota | 72% | 72% | 76% | 69% | n/a | n/a |
| Ohio | 81% | 81% | 75% | 80% | n/a | n/a |
| Oklahoma | 72% | 71% | 77% | 58% | n/a | n/a |
| Oregon | 75% | 75% | n/a | n/a | n/a | 71% |
| Pennsylvania | 72% | 72% | 78% | n/a | n/a | n/a |
| Rhode Island | 69% | 69% | 72% | 66% | 73% | 64% |
| South Carolina | 67% | 68% | n/a | 61% | n/a | n/a |
| South Dakota | 66% | 66% | 72% | n/a | n/a | n/a |
| Tennessee | 73% | 73% | n/a | n/a | n/a | n/a |
| Texas | 75% | 75% | 84% | 70% | 61% | n/a |
| Utah | 71% | 71% | 75% | 64% | 73% | 62% |
| Vermont | 72% | 72% | 75% | n/a | n/a | n/a |
| Virginia | 75% | 76% | 76% | n/a | n/a | n/a |
| Washington | 63% | 64% | n/a | 60% | n/a | n/a |
| West Virginia | 76% | 77% | 83% | 74% | 76% | n/a |
| Wisconsin | 64% | 67% | n/a | 74% | 64% | n/a |
| Wyoming | 79% | n/a | n/a | 79% | n/a | n/a |
NOTES: Some estimate are “n/a” because point estimates do not meet the minimum standards for statistical reliability.
SOURCE: Kaiser Family Foundation analysis of the Center for Disease Control and Prevention (CDC)’s Behavioral Risk Factor Surveillance System (BRFSS) 2014-2016 Survey Results. Three-year merged dataset used to ensure adequate sample sizes for statistical analysis. |
Topics


